Plot & Analyze UV-VIS spectrum
Summary
Use the Analyze spectrum tool for analyzing the calculated spectra, graphical editing it and adding experimental ones.
Usage
See above the following:
Displaying spectra
Two forms of Analyze Spectrum window
Working with experimental spectra
Spectra analysis
Line shapes
Graphic design of spectra diagrams
Calculated Spectrum options & Energy shift
Spectrum diagram options
Displaying spectra:
To show the Analyze Spectrum window click the menu Tools --> Analyze Spectrum.
Having the files with the calculations (output files from quantum-chemical programs) spectra data (using TDDFT or CIS methods (for Gaussian outputs it is possible to plot EOM-CCSD)) the Analyze Spectrum window will show them.
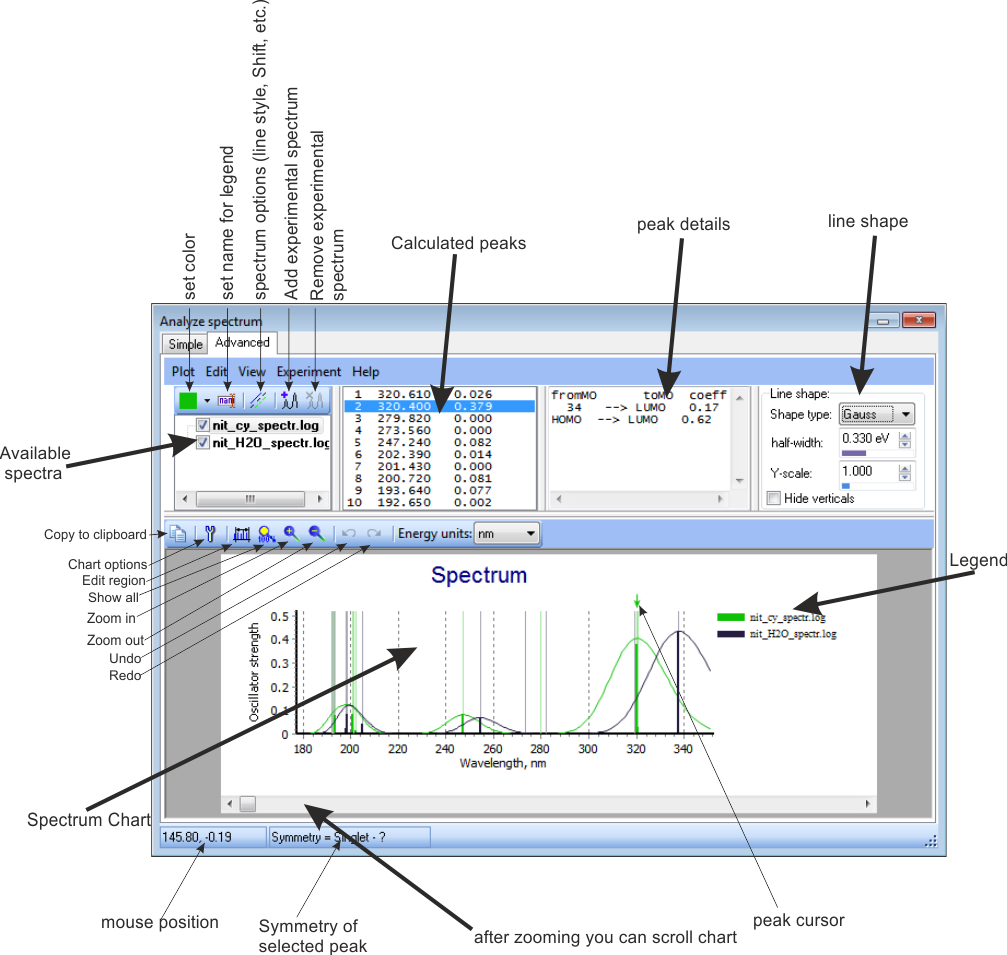
The figure below presents the main elements of the window for working with spectra:
Two forms of Analyze Spectrum window
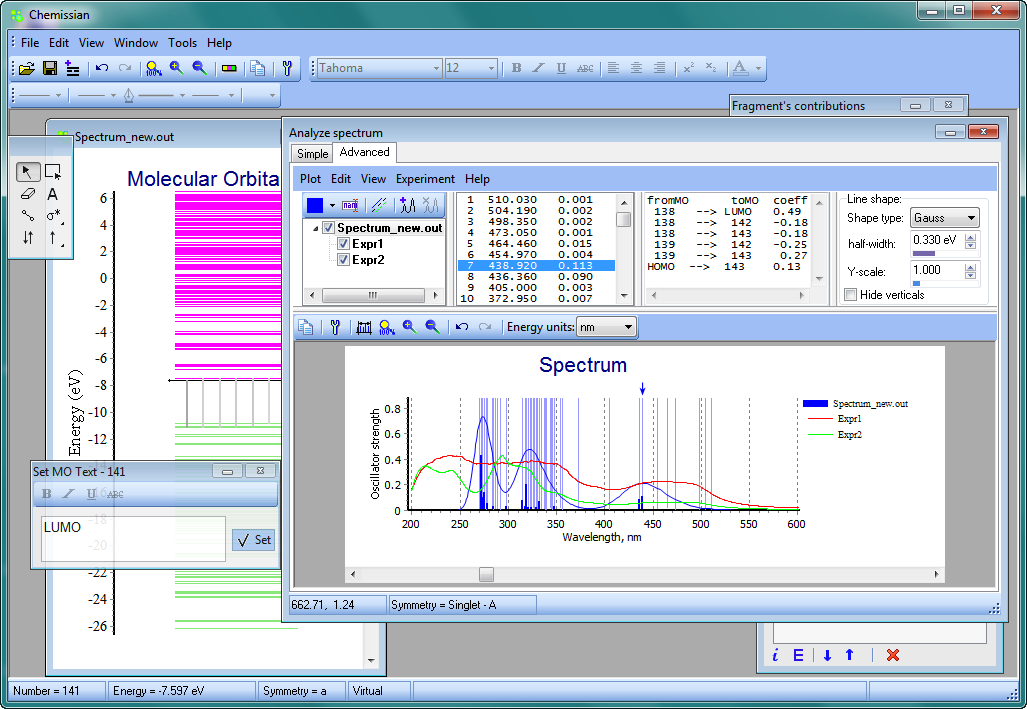
The Analyze Spectrum window may be viewed in two ways: Simple и Advanced (see figure):
- In the Simple view only the list of the calculated transitions (wave length and intensity) is presented.
- In the Advanced view the spectra diagram is also presented with its wide range customizing tools - for adding experimental spectra, graphical editing etc. (see below)
Working with experimental spectra
To add experimental spectra on the calculated one:
- in the Available Spectra list (see fig.) click the left mouse button on the calculated spectrum on which you want to fit experimental one;
- click the
 icon and follow the experimental spectrum adding wizard:
- in the wizard click the Next button and paste (using Ctrl+V shortcut) experimental data in the form where the first column is the wave length and the second is oscillator force (intensity) e.g.:
199.94 0.89400
201.2 0.95050
202.04 1.01954
202.25 1.03881
202.67 1.07768
........................
- then click the Next button to see the recognized data in a table form
- click Finish
Below there presented an example of calculated spectrum with fitted two experimental ones:
- To remove the experimental spectrum select it in the Available Spectra list and click the
 button
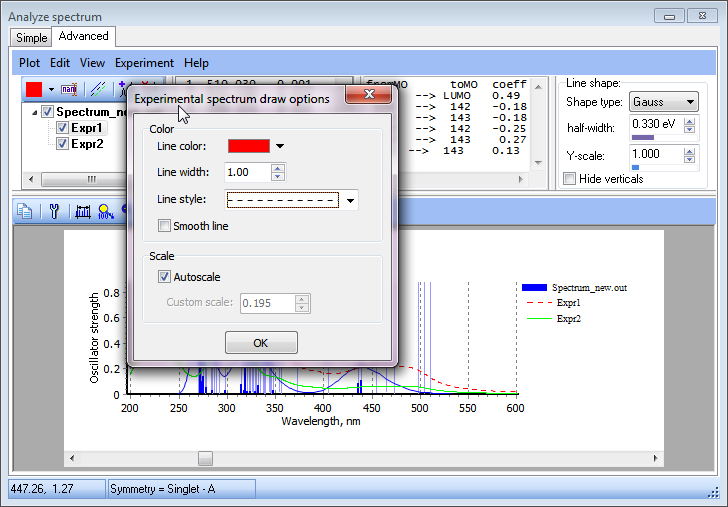
- To change some drawing details of the experimental spectrum click the menu Experiment --> Experiment draw options and specify required options:
Spectra analysis
To select the custom energy range (wavelength range) for your diagram use the menu View-->Set energy range.
Also you may use Zoom In, Edit--> Zoom out or Edit--> Show All buttons
Another way is to place the mouse on the energy (wavelength) axis then press the left button and holding it move left or right to select the range (as in the Molecular orbitals editor).
You can move between the peaks lines: select spectrum of interest (see Available spectra fig.) and click on the spectrum diagram, use the left/right keyboard cursor to move between the peaks. The current peak will be selected with the peak cursor (see fig.) directly on the diagram and in the Calculated Spectrum peaks list (see fig.). Besides the corresponding transitions between MOs will be shown on the molecular orbitals diagram and the line intensities of these transitions will be in correspondence with the magnitudes of the contribution to the excited state under consideration.
In the Peak details field (see fig.) the composition of the current peak will be shown i.e. list of the corresponding transitions between MOs with the coefficients.
As default in the Calculated Spectrum peaks list (see fig.) the numbers of MOs (between which the transitions occur) will be shown, however using the MO Data window in the Molecular orbitals editor you can associate the custom text with molecular orbitals (e.g. MO consists of d-atomic orbitals of metal of your metalloorganic compound or maybe it is localized on a ligand or may be it is HOMO or LUMO etc.), than instead of the MO number in the list you will see the associated text.
The latter is very useful for the analysis of the transition nature. Say you understand that the transition is due to excitation from the orbitals of a metal (corresponding MO is localized on metal atom) to the ligand orbitals - you may add a simple text label such as "M-L" etc. directly on the diagram.
Line shapes
Chemissian can calculate Gaussian- and Laplace-type shapes using calculated peaks. You can set the peak half-width at half-height and scale-coefficient.
Graphic design of spectra diagrams:
Use tools from the Draw Tools tool window (Text tool, Standart text tool, Connector tool) for graphical editing of a diagram.
To edit the diagram Title and Foot text double click it with the mouse left button and start editing the text.
If the title (foot) is invisible you may enable it using the options window (see below).
You can use a wide range of font styles using the Format panel (like you do it in the most rich-text processors):
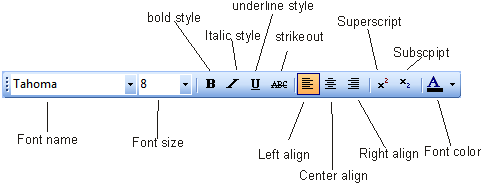
To use it select some text fragment and select in the Format panel needed style;
Note
Use the menu item Edit ---> Undo/Redo (or shortcut Ctrl+Z/Ctrl+Y) to undo/redo the actions.
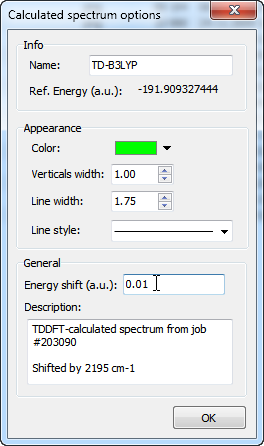
Calculated Spectrum options
To change the drawing parameters of the peaks and calculated shapes click the menu Edit --> Draw options and specify different options:
- Name which will be displayed in the legend
- Line style, color, width, etc.
- Comment
- Energy shift: it is useful in the case of multiple calculated spectra placed on the same diagram. For example, consider the situation where some excited states were obtained in TDDFT calculation using singlet ground (reference) state while others were obtained from triplet reference state (which is actually is an excited state relative to the ground singlet state). Thus, to obtain total spectrum of excited states one should shift all the excited states from the calculation with triplet reference by the triplet-singlet gap
Spectrum diagram options
To specify displaying diagram options click the
General tab:
- height/width
- whether to continue the spectrum peaks (it is useful when the peak has small intensity (e.g. the case of forbidden transition) and it is not visible on the diagram)
- whether to show the vertical grid
- whether to show the legend
- whether to show the Title/Foot text
- diagram fields size (as a percentage of the diagram)
- "Additional free space": - it is the height in the pixels between the upper label of the left axis and the bottom of the title. In this additional space it is also possible to place the text labels associated with the peaks
Color tab:
- Select the style and color of the diagram background
- Axis tab - specify axes displaying style:
- Left axis - the calculated peaks intensity
- Bottom axis - the calculated and experimental wavelength you can specify:
- axes label text, font
- mark font